To create a custom report with graphs, select Pivot, located next to Table and Detailed, from the Custom Report modify menu.
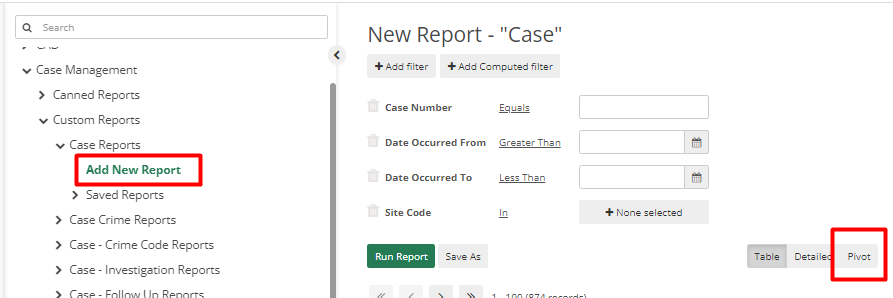
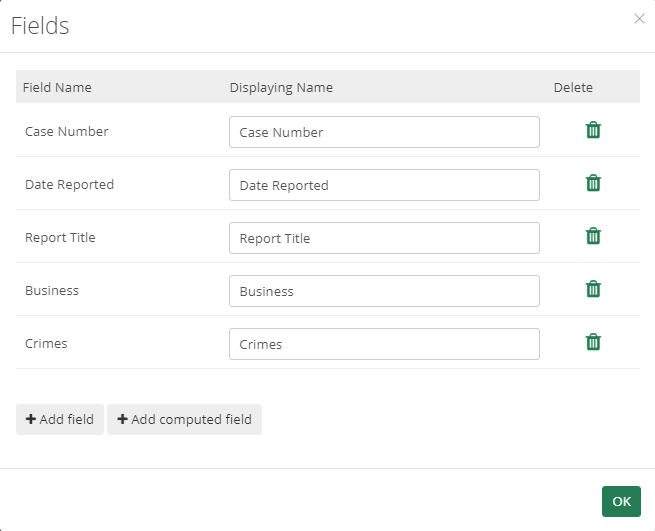
Once the user clicks on "Pivot" they will be able to modify what kind of graph needs to be generated. Prior to editing the graph, make sure to have all the fields added to the report you want to visualize on the graph. The user can add or modify fields by clicking on the 'Fields' button.
After adding all the fields, the user can begin customizing the graph. There are many different types of graphs that can be created. The list of these is provided below.
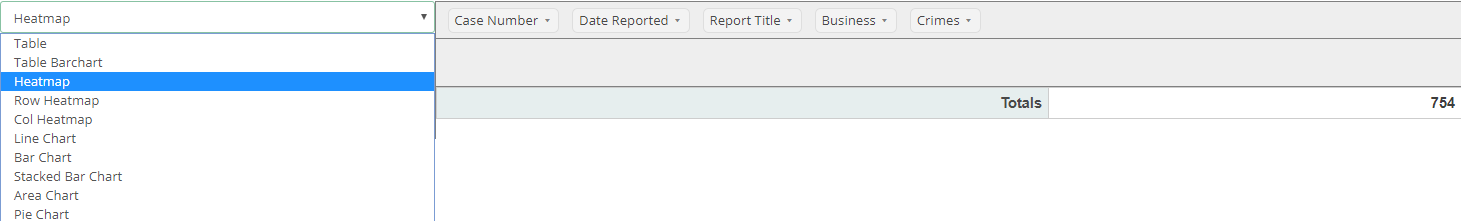
The user can then modify which fields they want to be measured on the graph. To modify this the user can simply click and drag on the field to either section.
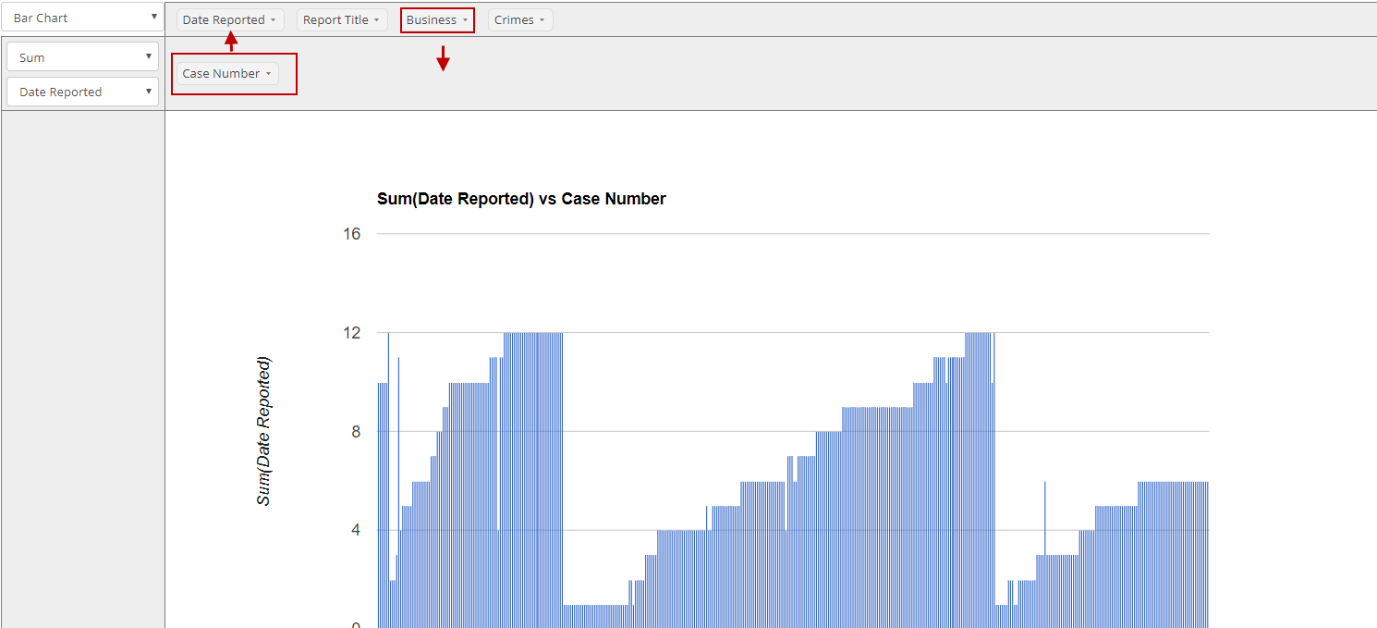
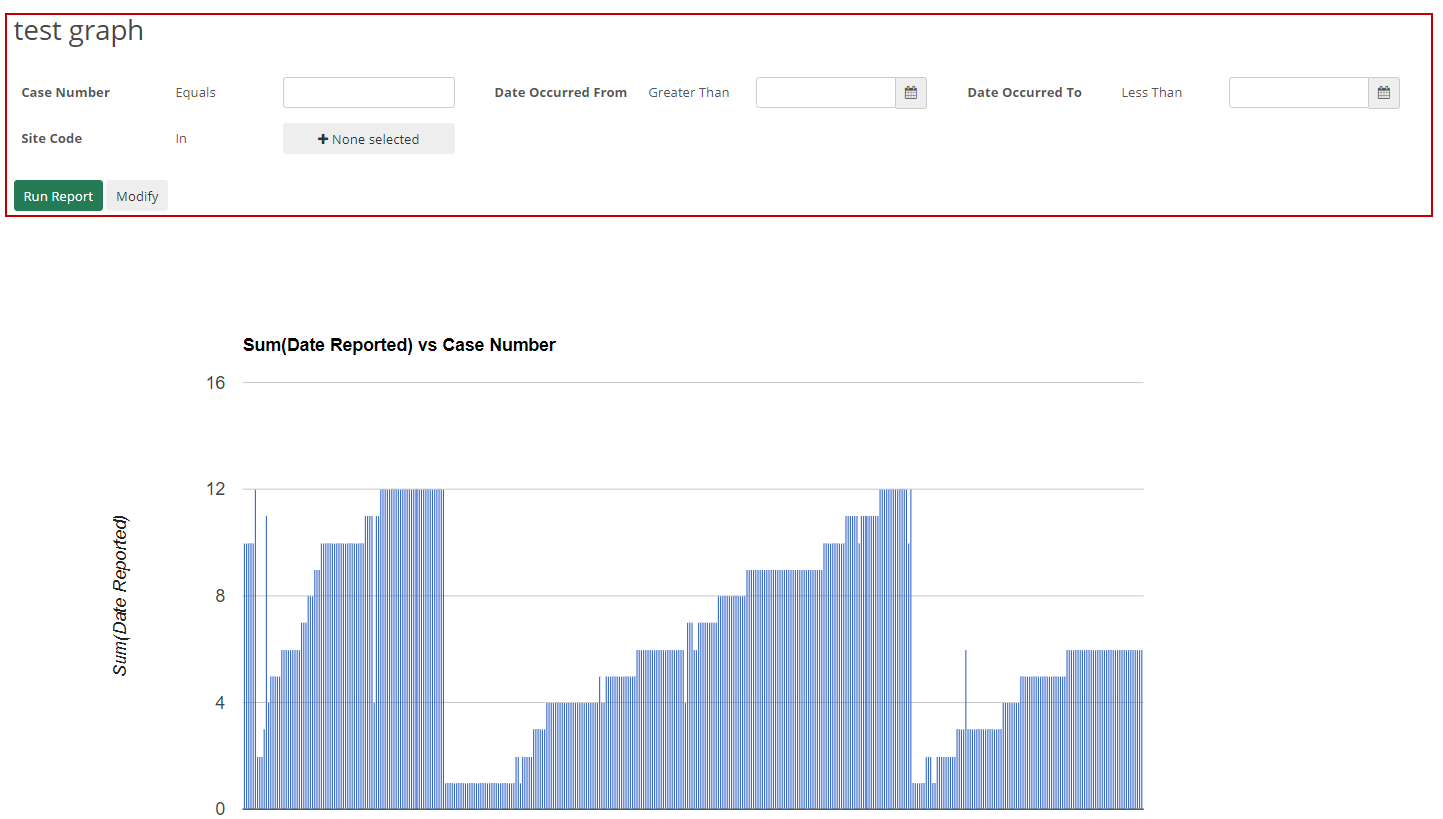
The graph will update as you modify the placement of these fields. If the user is done editing what the graph needs to look like the user can then save the report. The report will be accessible in the Report Center. The users will also be able to run the graphed report with filters if looking for specific criteria.