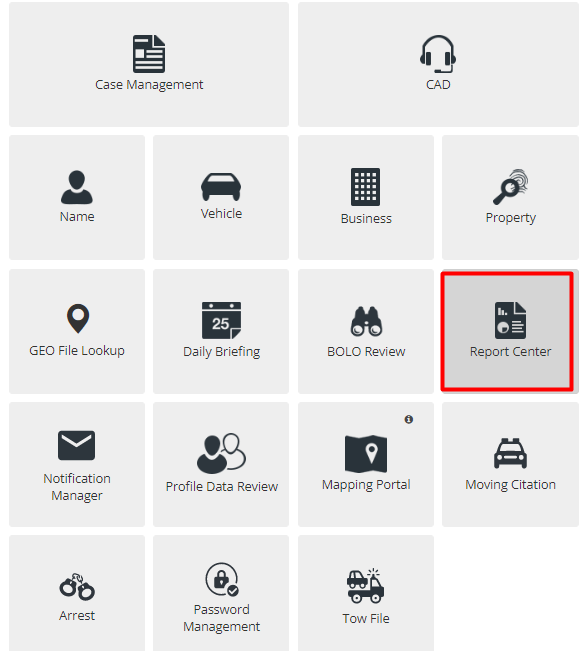
Overview
The ARMS Report Center provides access to Canned and Custom reports. Canned Reports are created by ARMS and are available for immediate use. Custom reports are created by a user for the department. Custom reports give the User the ability to modify what data is collected. Reports can be displayed in chart, table or graph form.
When launching the Report Center module the first screen will display a side menu with two columns on the main page, Recently Accessed and Popular. Recently accessed is specific to the user. Popular displays the most used reports by the department.
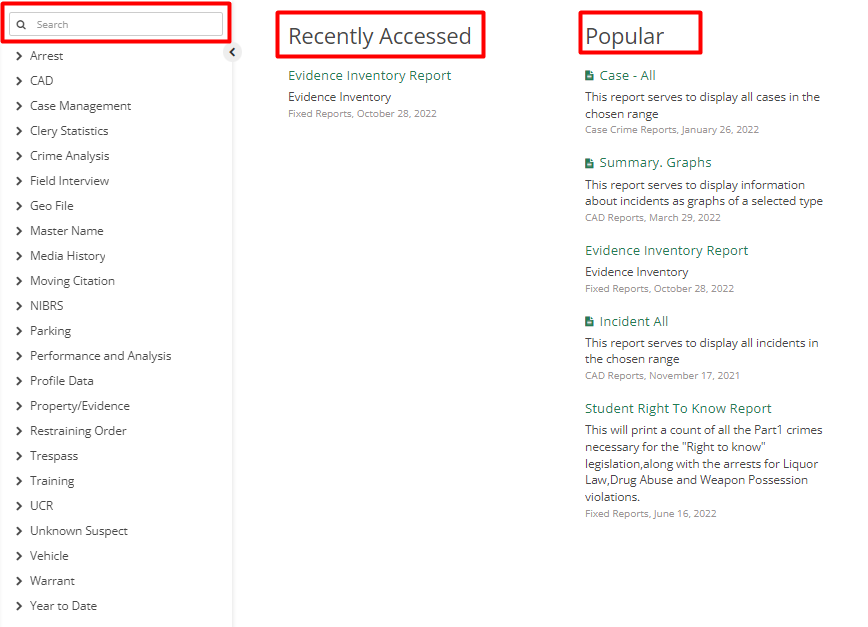
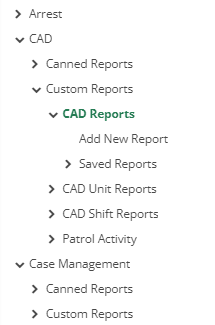
On the left, there is a menu that has multiple options for reports which are separated category-wise. It also has a search option that searches from the list of reports provided in ARMS.
After selecting a category, a dropdown menu will appear. A user has the option to choose between Canned or Custom Reports.
Canned Reports are created by ARMS and can be filtered as per one’s needs.
Custom Reports are one that departments can create for themselves.
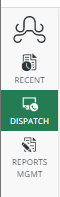
Dispatch Display provides Officers' a quick view of the status of units and open calls.
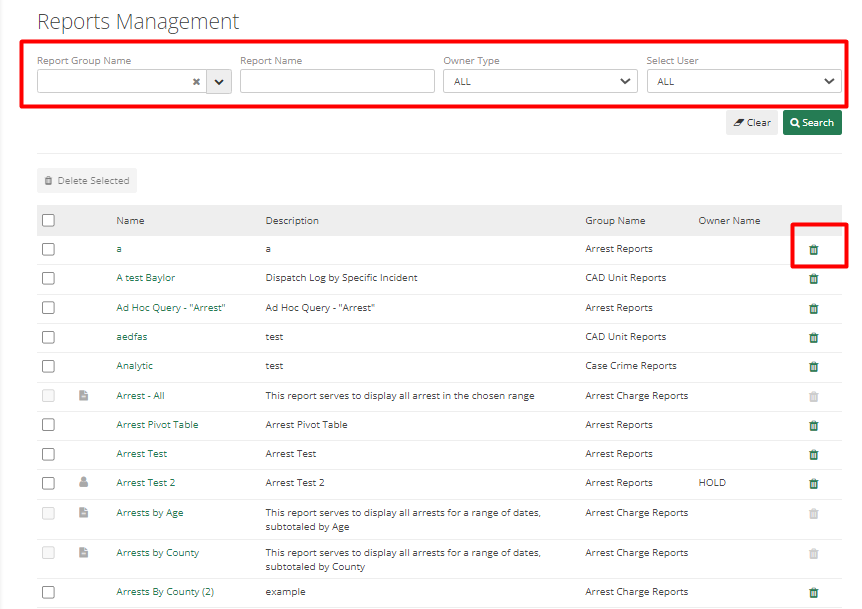
In Reports Management, an Officer can search a report by name or creator. An Officer can also delete a report if they have the required permissions. To delete a report hit the trash can icon.
Canned Reports
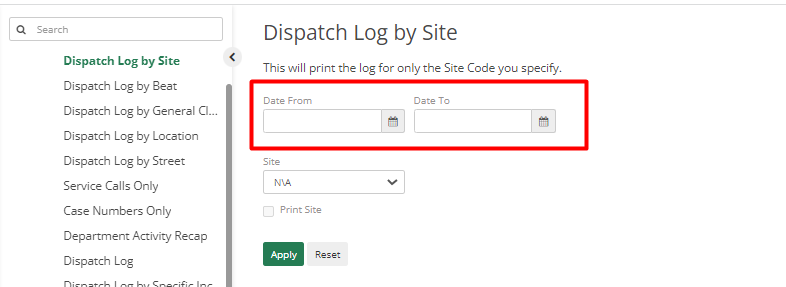
Canned Reports are already available to departments when they first access ARMS. To find any of the Canned Reports click any of the categories on left and then click on Canned Reports under that.
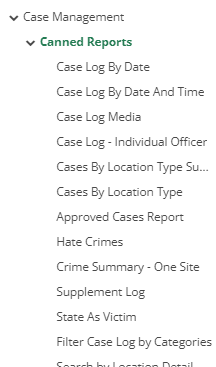
It will show a full list of report options provided by ARMS. Click on any of the reports to see more about it. After selecting a report, an Officer can filter by selecting Date From and Date To. Click Apply and a report will generate from data collected between the selected dates. Reports cannot be manipulated.
There are multiple options for what an Officer can do with a report. An Officer can Print, Export to PDF, Export to Excel or Export to RTF.
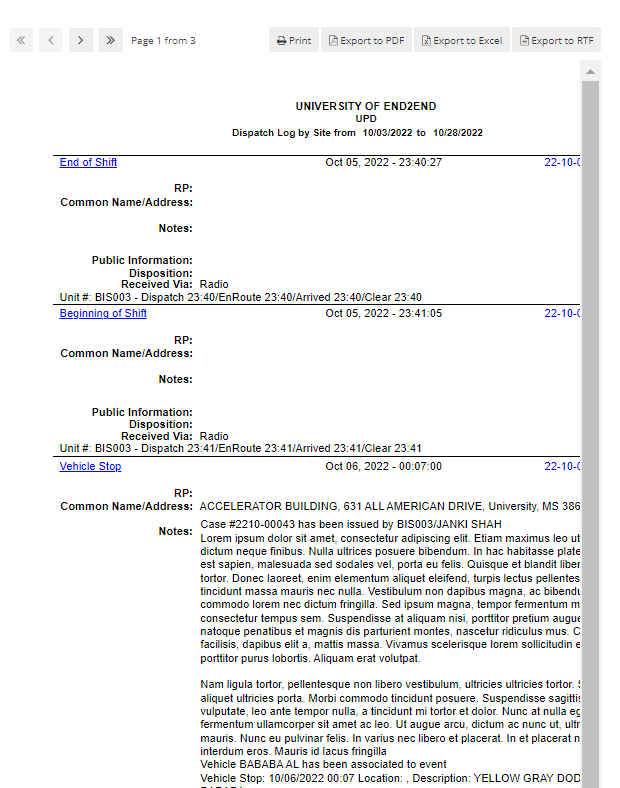
Each Canned Report has different options to be filled by the Officer as per the type of the Report. For example, reports in table form will look best when exported to Excel.
Custom Reports
Custom Reports are a way for the department to create a brand-new report based on the criteria that is needed. If the Officer wants to create a Custom Report, then they need to go to the Custom Report option under the category they want to create a Custom Report for.
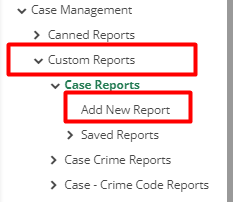
There are two options Add New Report and Saved Reports. Add New Report will create a new Report as per the information selected and Saved Reports will display all the reports saved by other Employees in the department.
After clicking Add New Report, it will display a few entries with the default setup which can be changed by selecting fields as per the type of report. Three main things for customizing reports are Filters, Group By and Fields.
Filters are what an Officer searches. Group By is if the officer wants to group them and it is not mandatory. Fields are headers or real data.
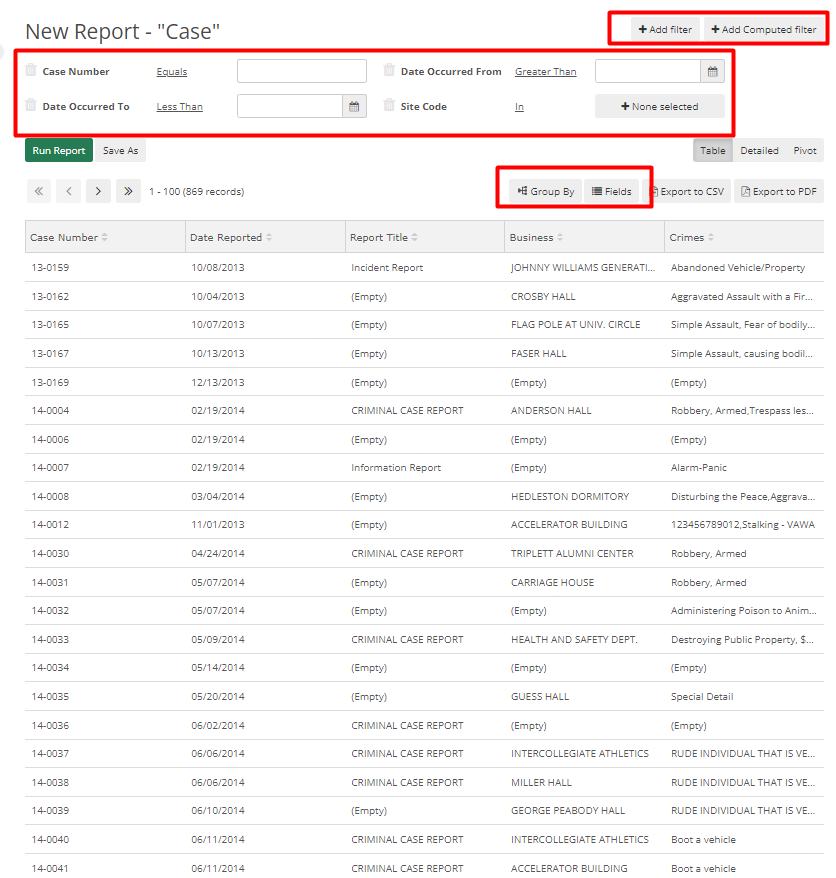
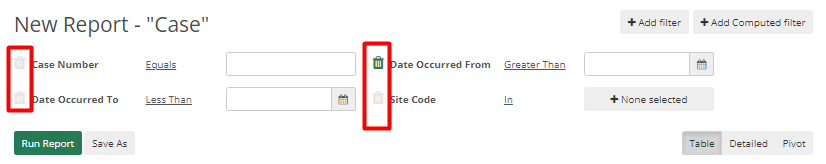
If someone wants to remove filter options, then they can click on the trash can icon. To add a new filter, they can click on Add Filter button and can choose from the list. So, after selecting the filter it can be searched by those selected options.
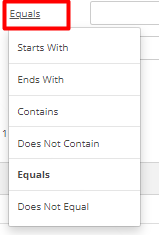
By clicking on Equals, an Officer can filter in multiple ways using Starts with, Ends With, Contains, Does Not Contain, Equals, and Does Not Equal.
To use a more descriptive way of filters, click on Add Computed Filter button. For example, instead of the filter by dates, users can also filter by Week, Weekday, Month, Quarter, etc.
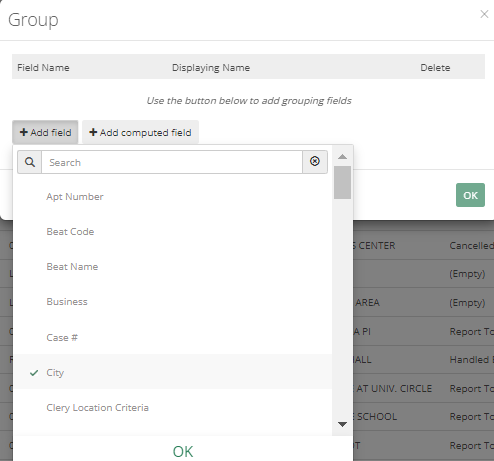
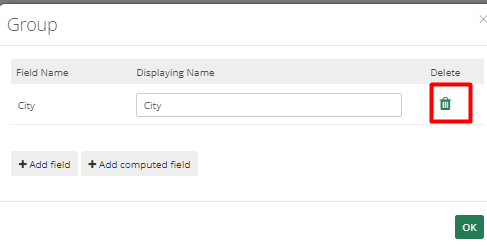
Group by has similar options like a filter i.e., Add Filter and Add Computed Field, but it can be grouped by unit, etc.
Applied Group By can be removed by clicking on the trash can icon.
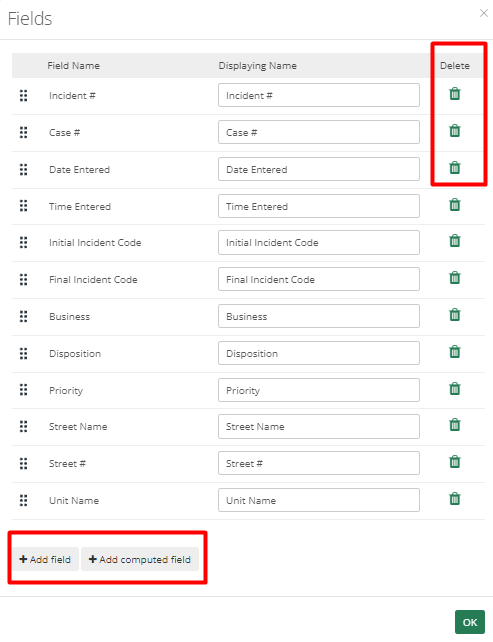
Fields are the information that is shown in the table. The unnecessary fields can be removed by clicking on the trash can icon. Required fields can be added by clicking on Add Field button Computed fields can be added by clicking on Add Compute Field button.
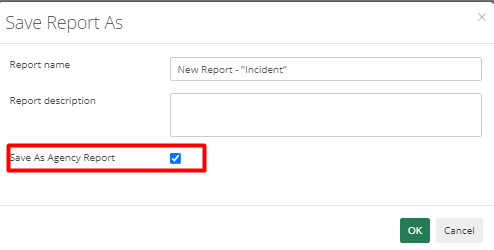
When a user has finished adding all the fields or groupings, select "Run Report" to run the report or "Save As" to save the report. All agency employees can view the report if the officer selects the "Save As Agency Report" checkbox. If not, only the Officer who created it can view it.
Report Types
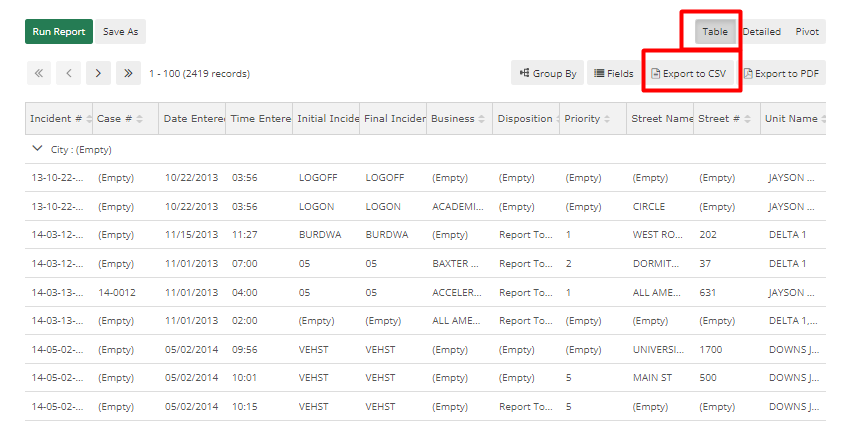
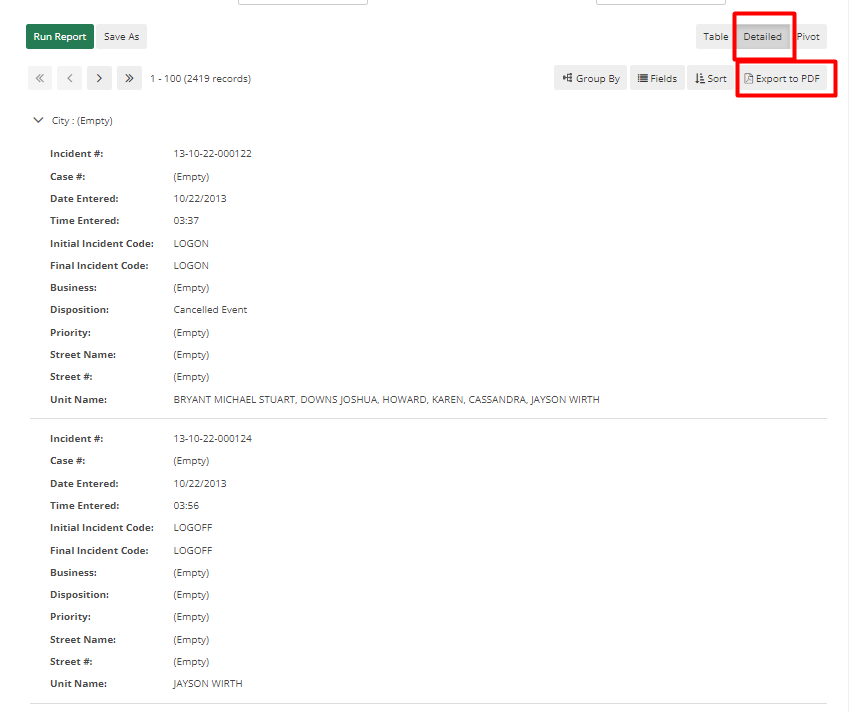
There are three types of Reports in ARMS. Table, Detailed, and Pivot.
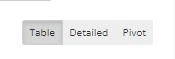
Table Type - By default, Reports can be viewed in Table type, can be exported in CSV format, and can be manipulated further if required.
Detailed - This format is similar to a report or log. It can be exported as a PDF.
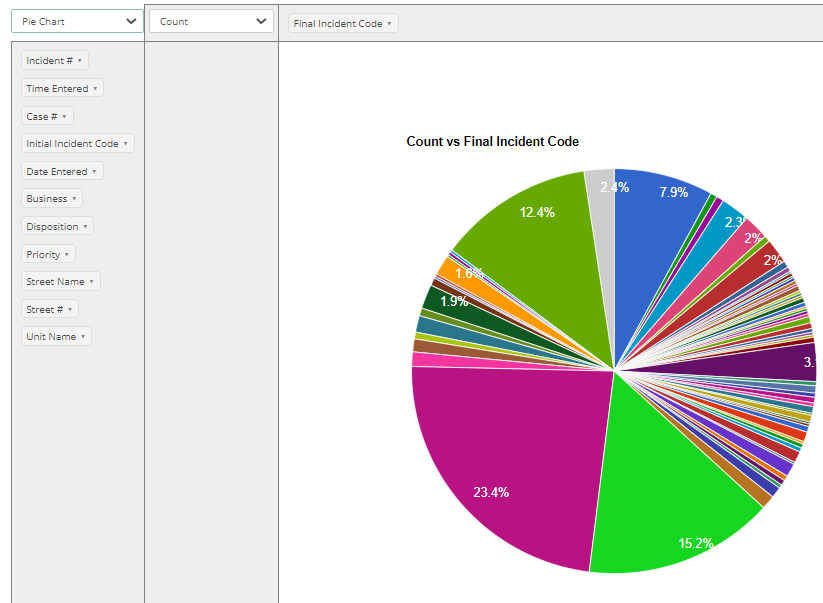
Pivot Type Report - It is used to create graphs and many kinds of tables. Both have a X and Y axis. As a result, fields can be added or dragged to the X-axis and Y-axis as needed.
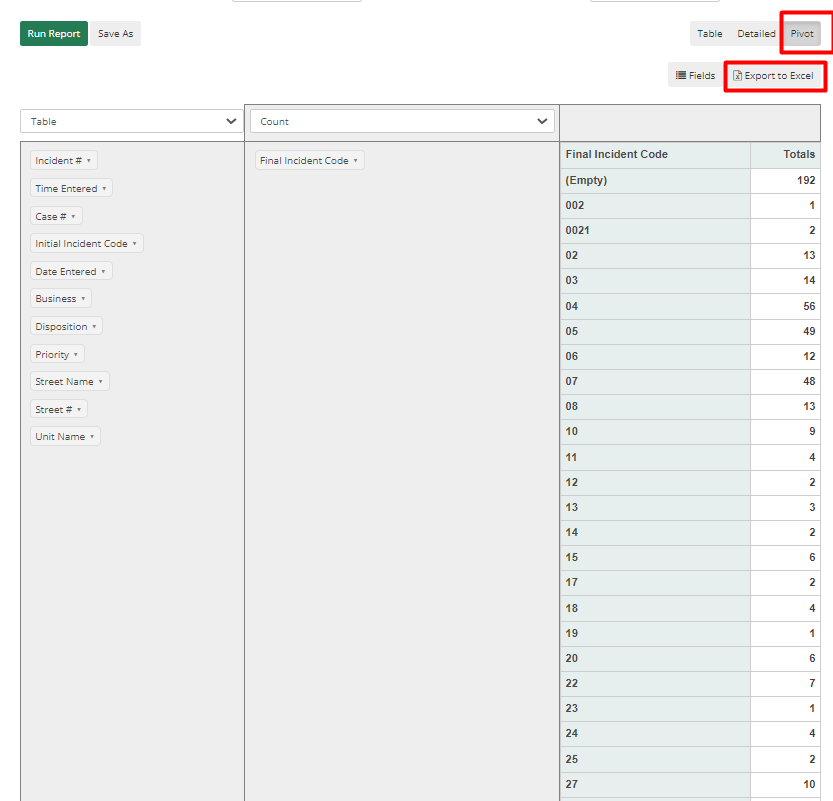
There are multiple options to view this type of Report. They are Table, Table Bar chart, Heat Map, Row Heatmap, Col Heatmap, Line Chart, Bar Chart, Stacked Bar Chart, Area Chart, and Pie Chart.
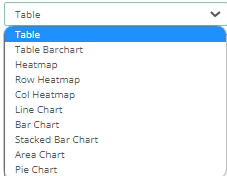
Below is an example of a Pie chart.